Analytics
Analytics shows how the brand is doing across every channel: who's following, what people see and engage with, which posts work, and when to post.
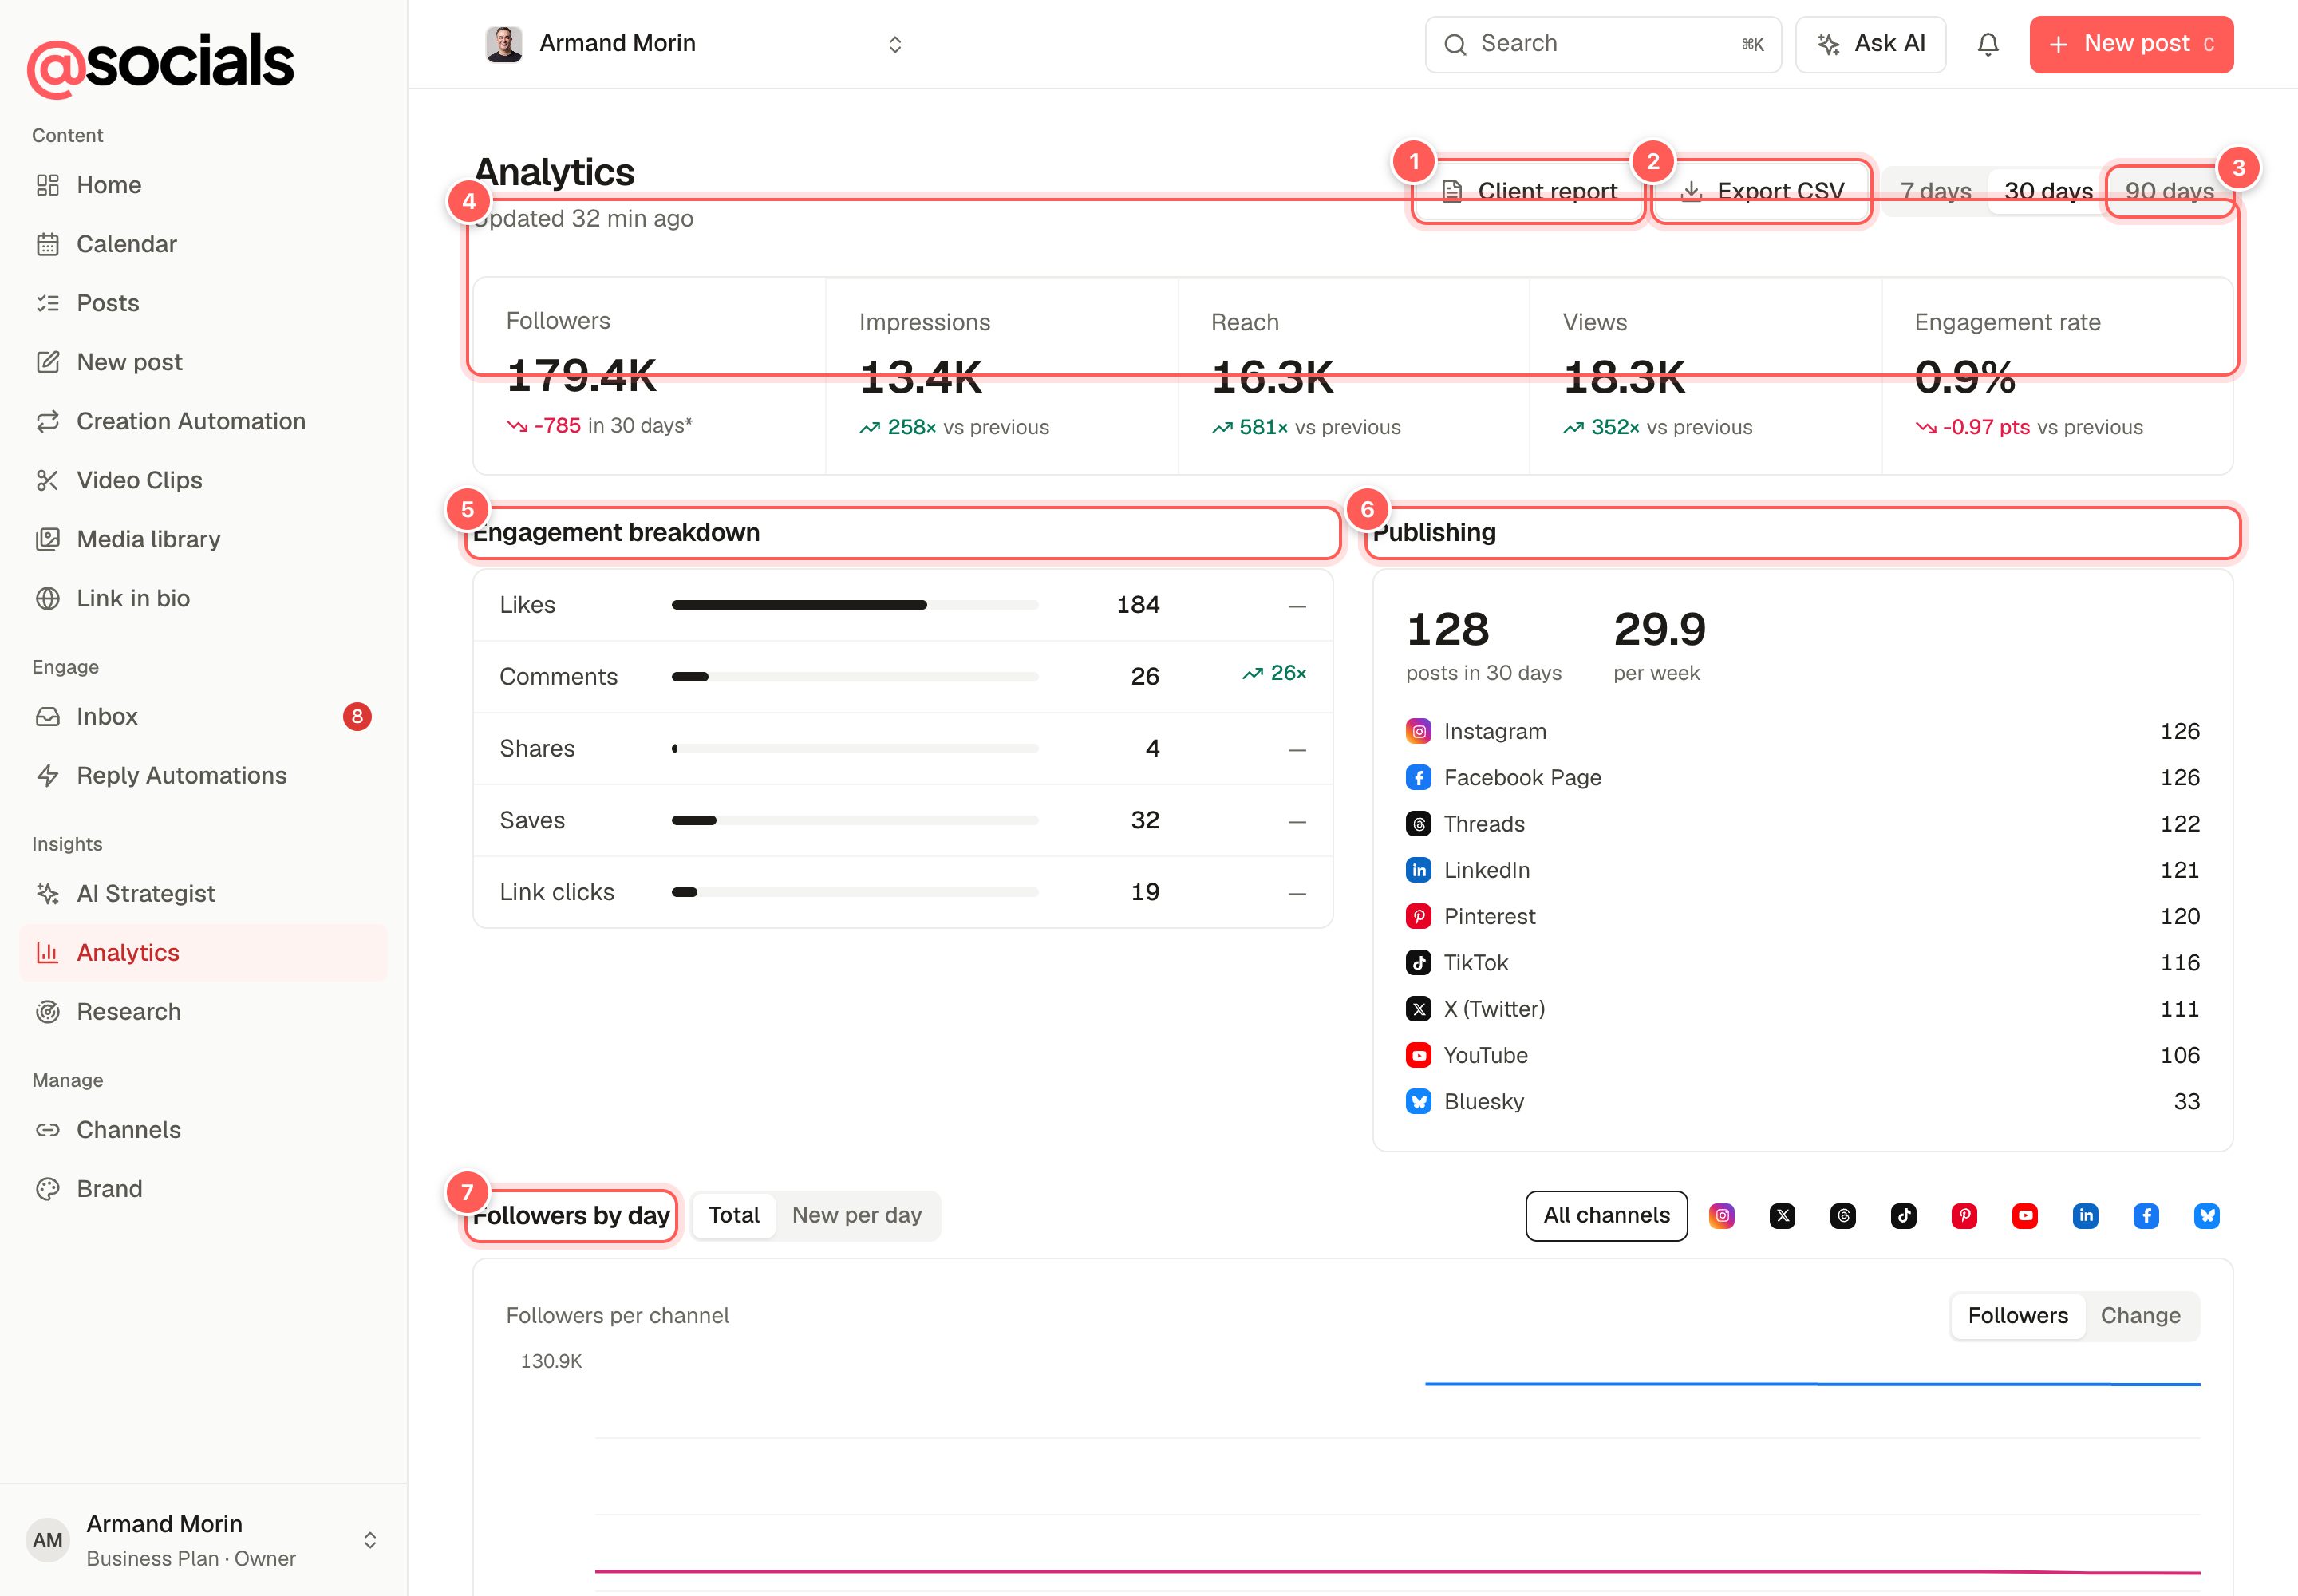
- Client report: a clean, printable report with your logo. See Client reports.
- Export CSV downloads the numbers for a spreadsheet.
- Date range: 7, 30 or 90 days. Every section follows it.
- Headline numbers: followers, impressions, reach, views and engagement rate, each compared with the period before.
- Engagement breakdown: likes, comments, shares, saves and link clicks.
- Publishing: how many posts went out and on which channels.
- Followers by day. See below.
Followers by day
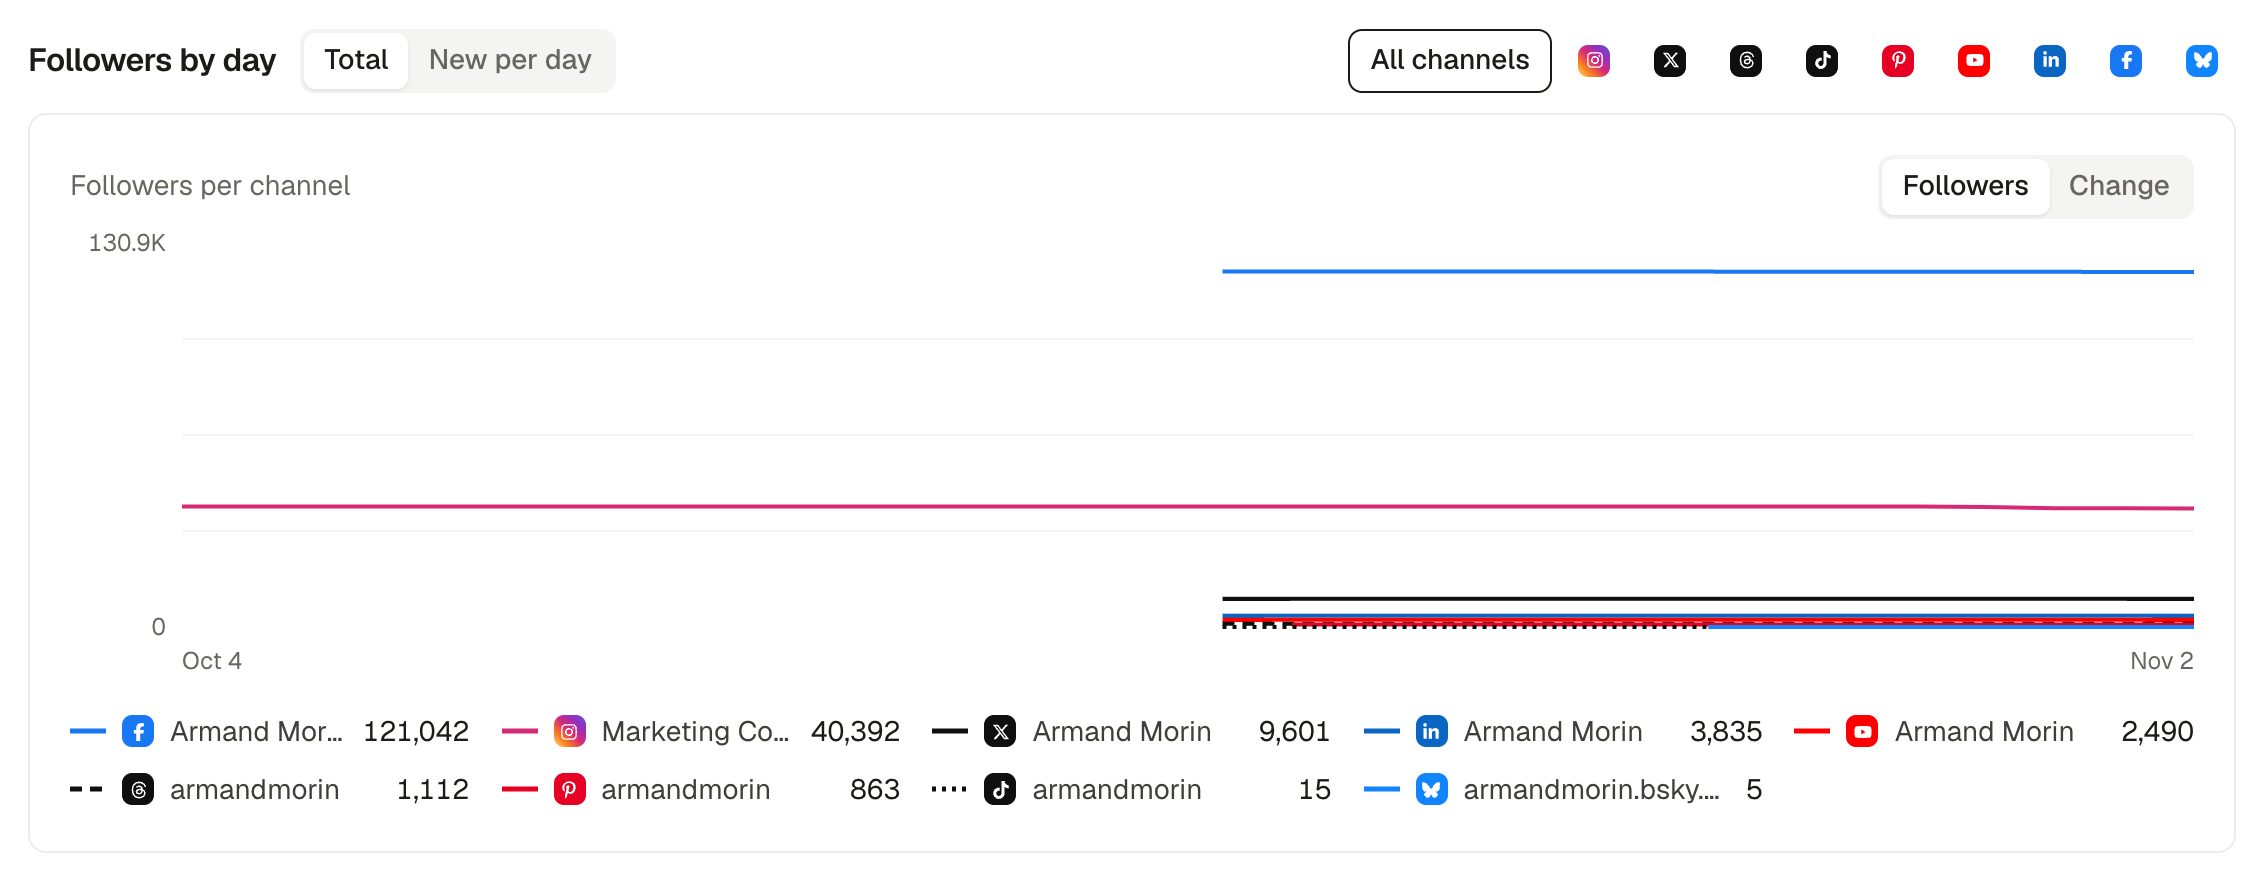
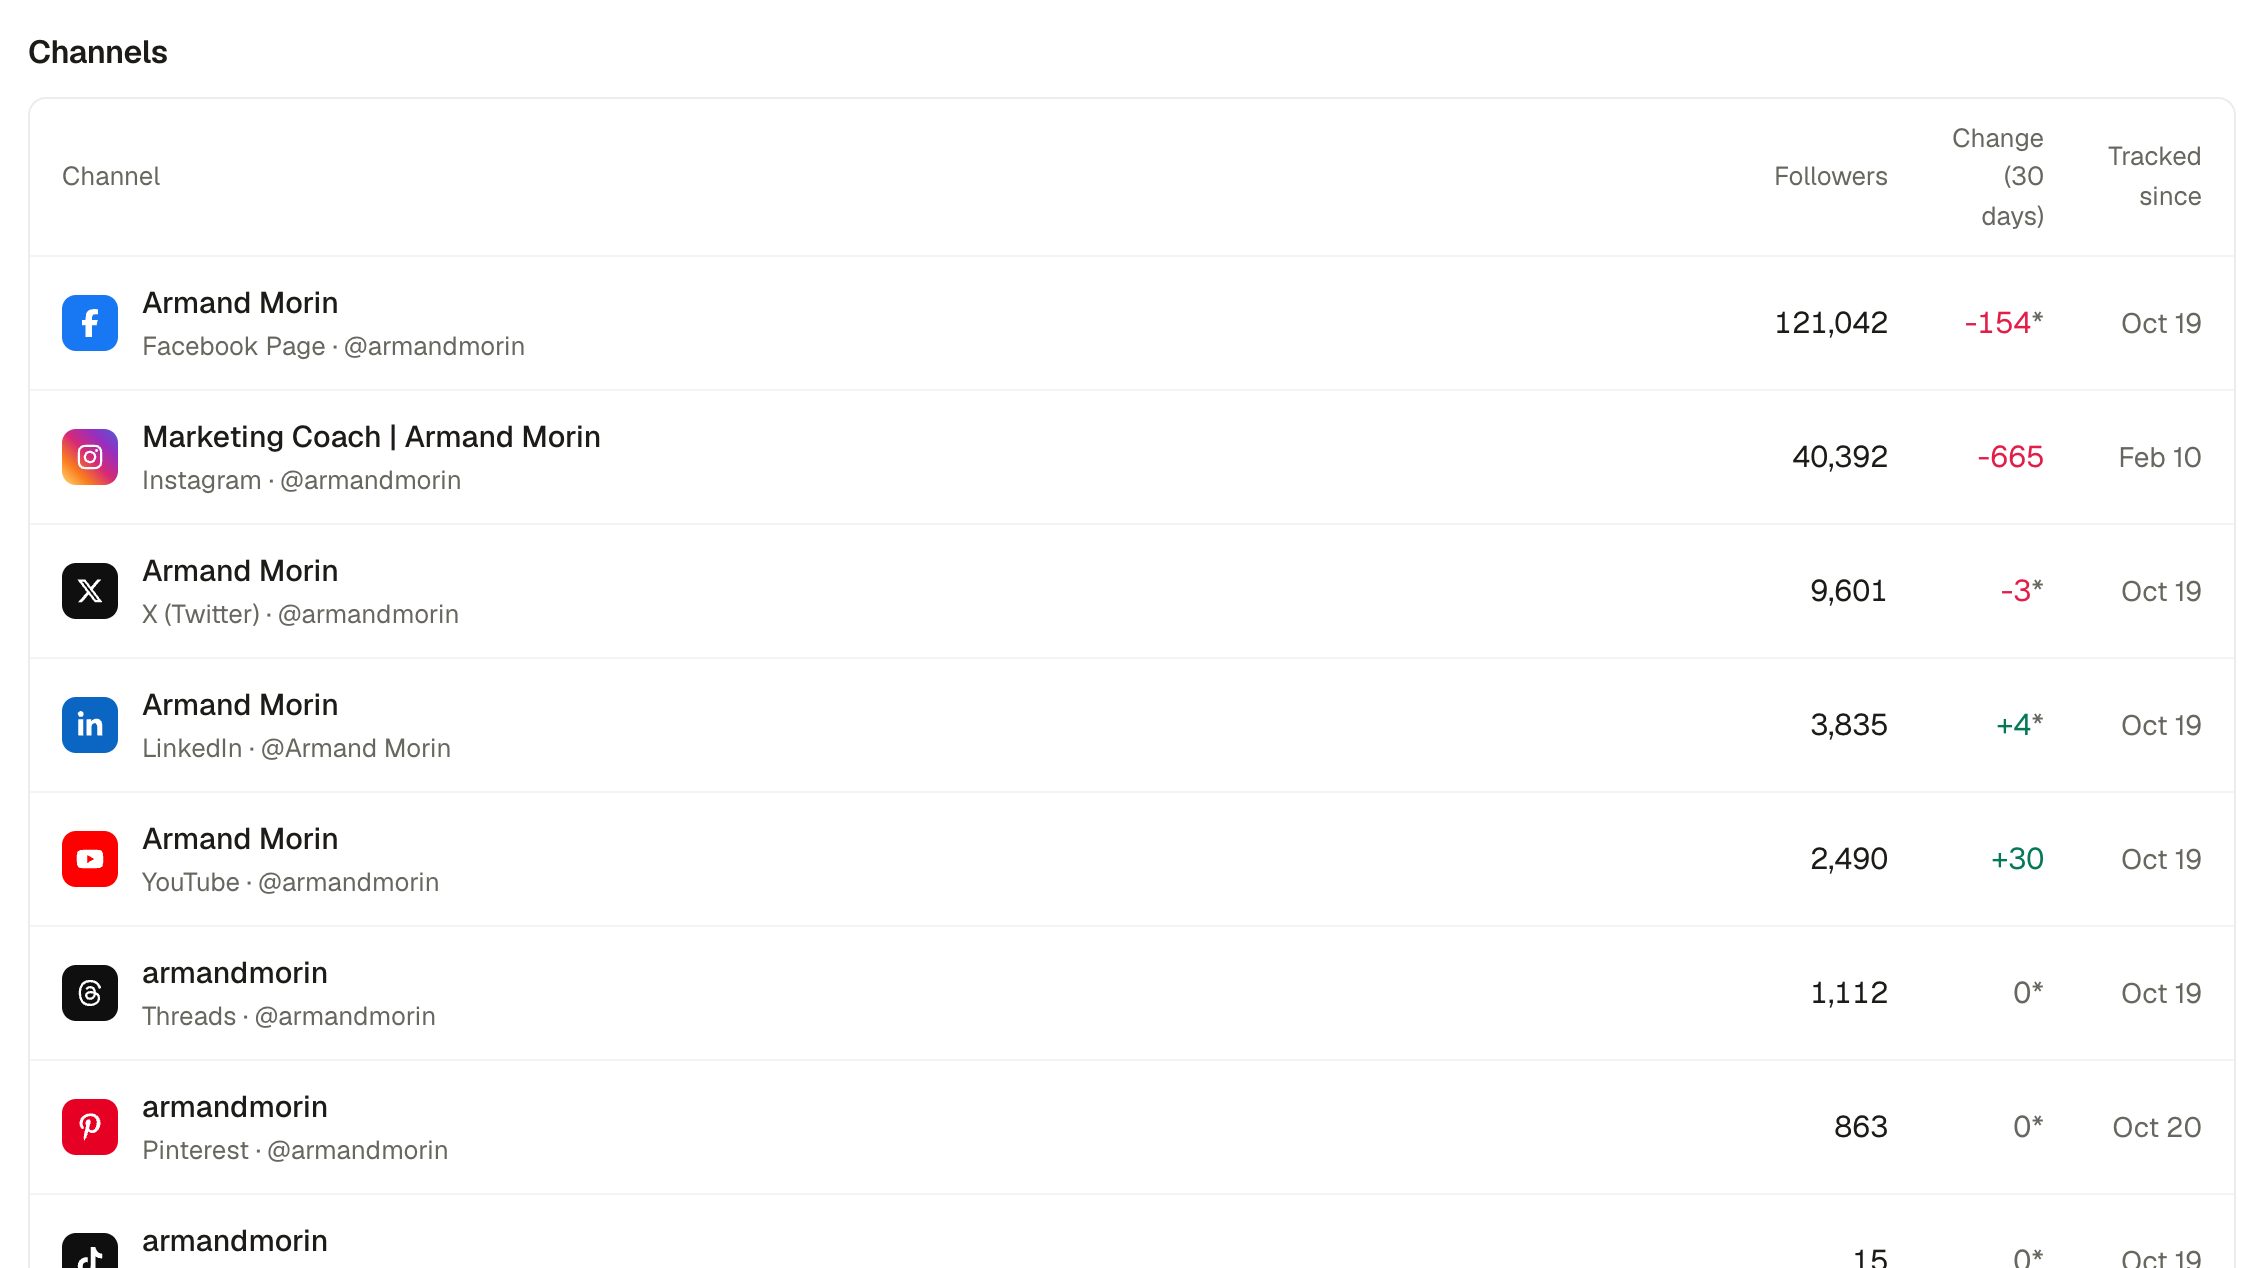
AtSocials records each channel's followers once a day, so the history starts from when you connected it (some networks provide earlier history, which is filled in once). The 30-day change is today's count minus the count 30 days ago.
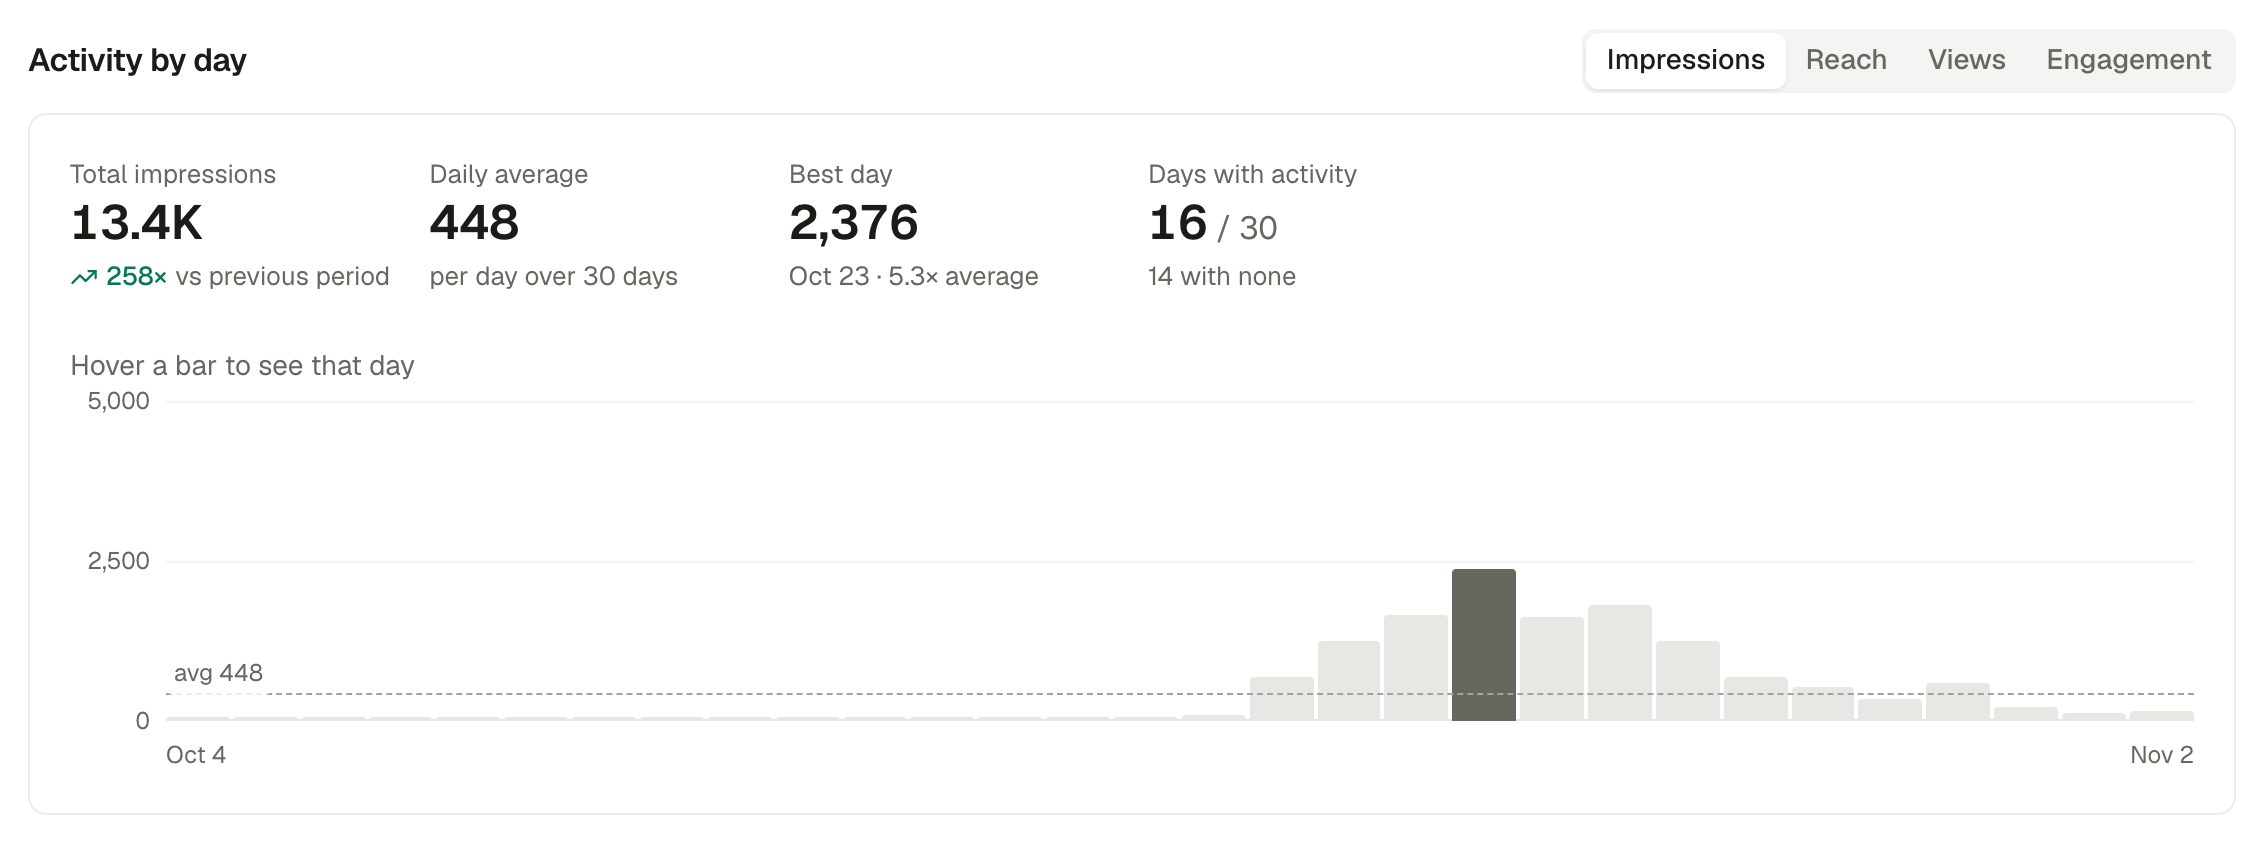
Activity by day
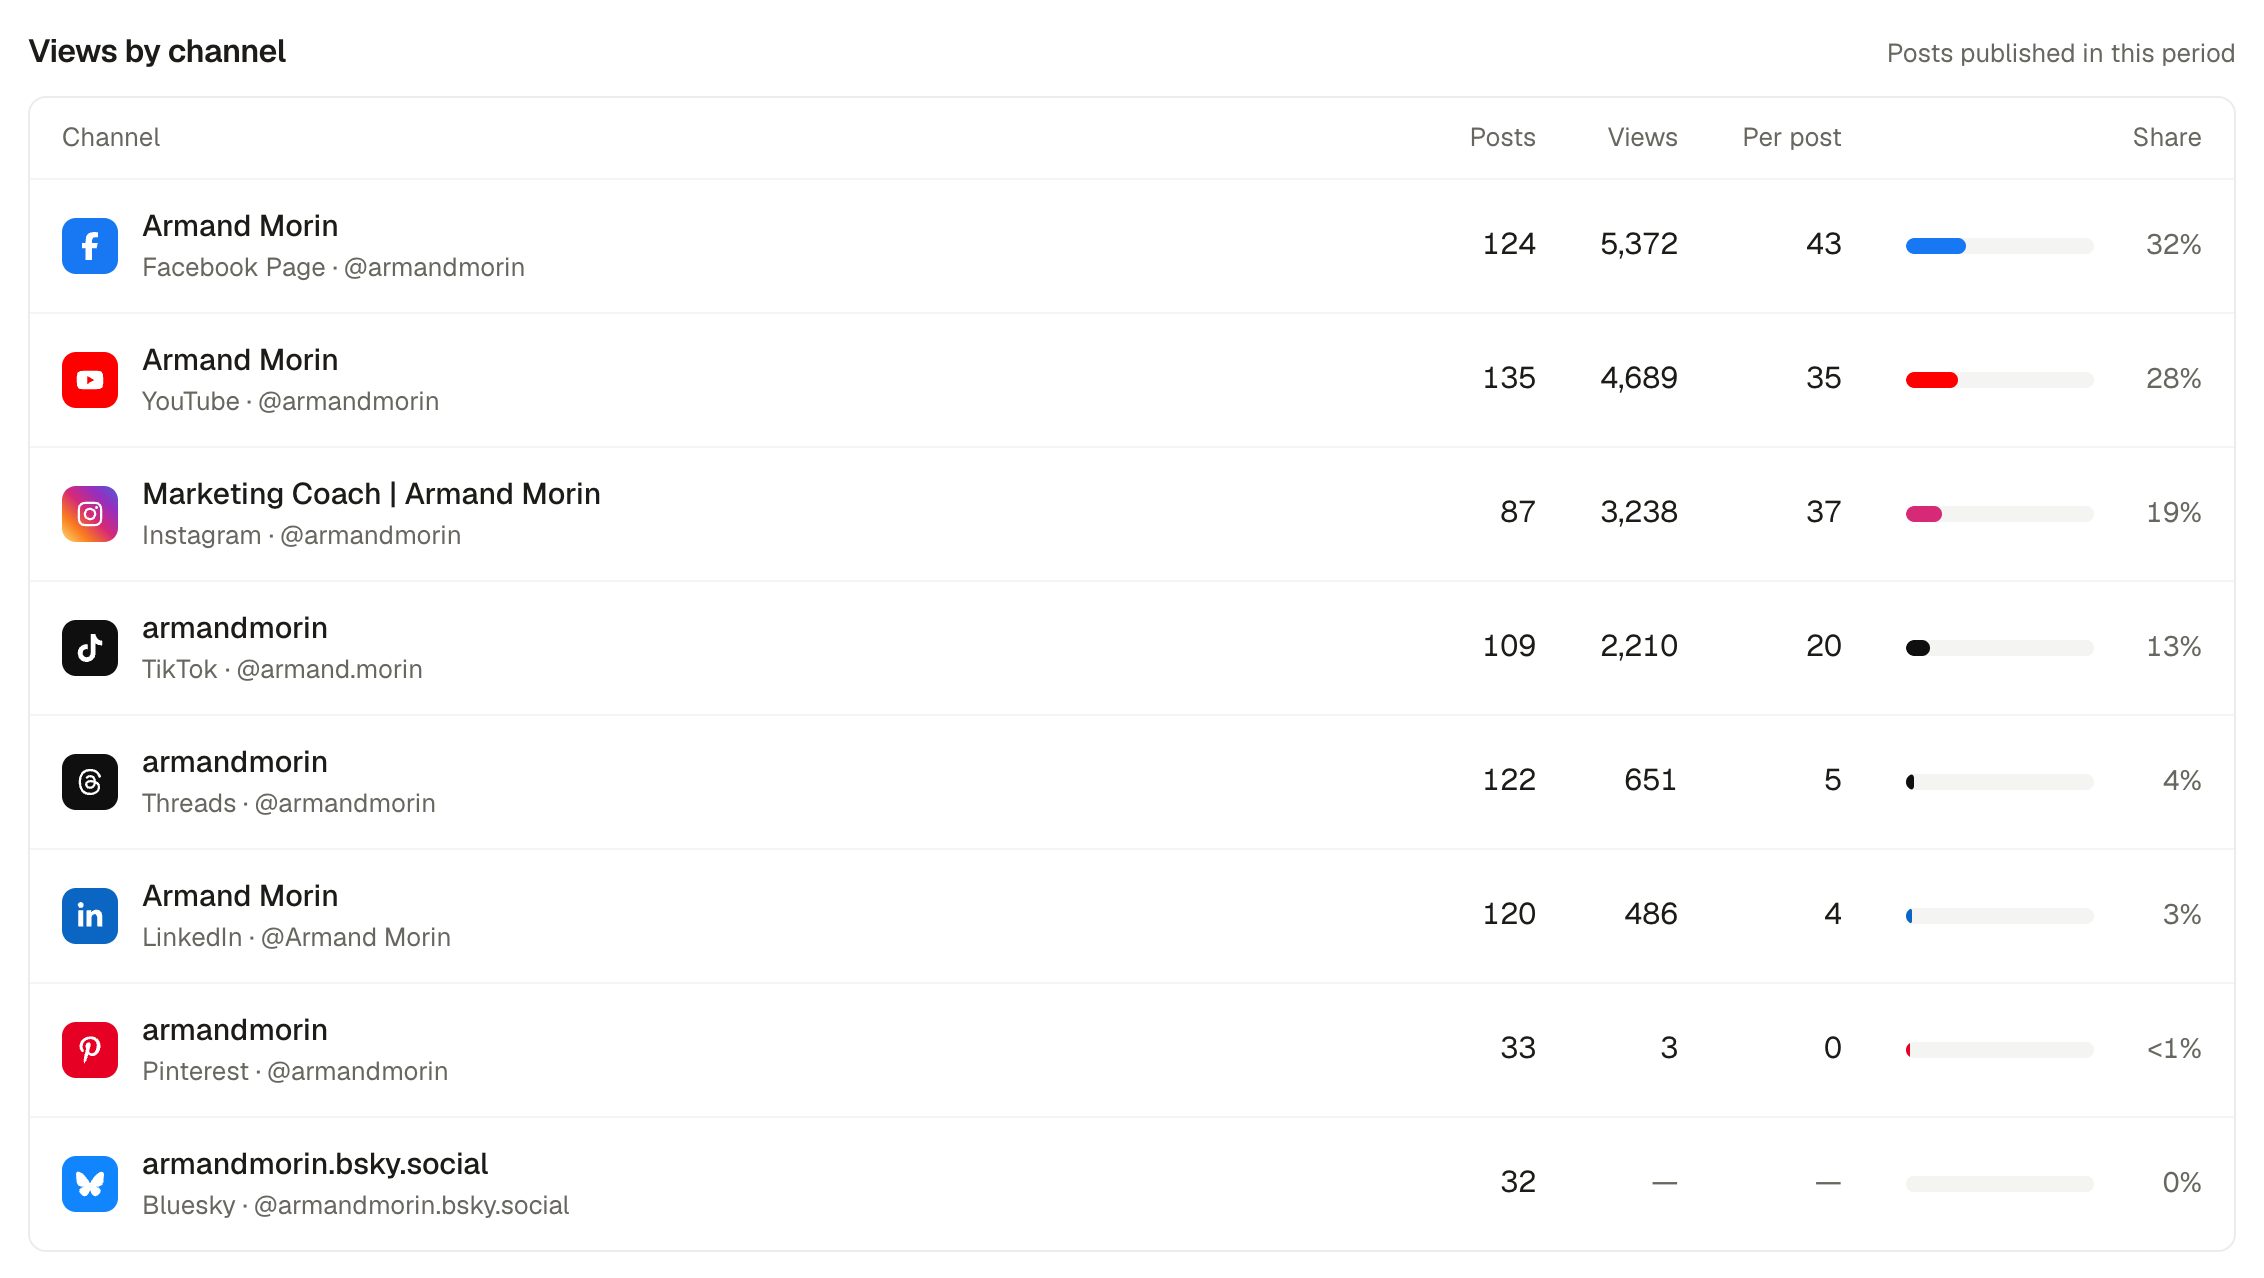
Views by channel
Top posts
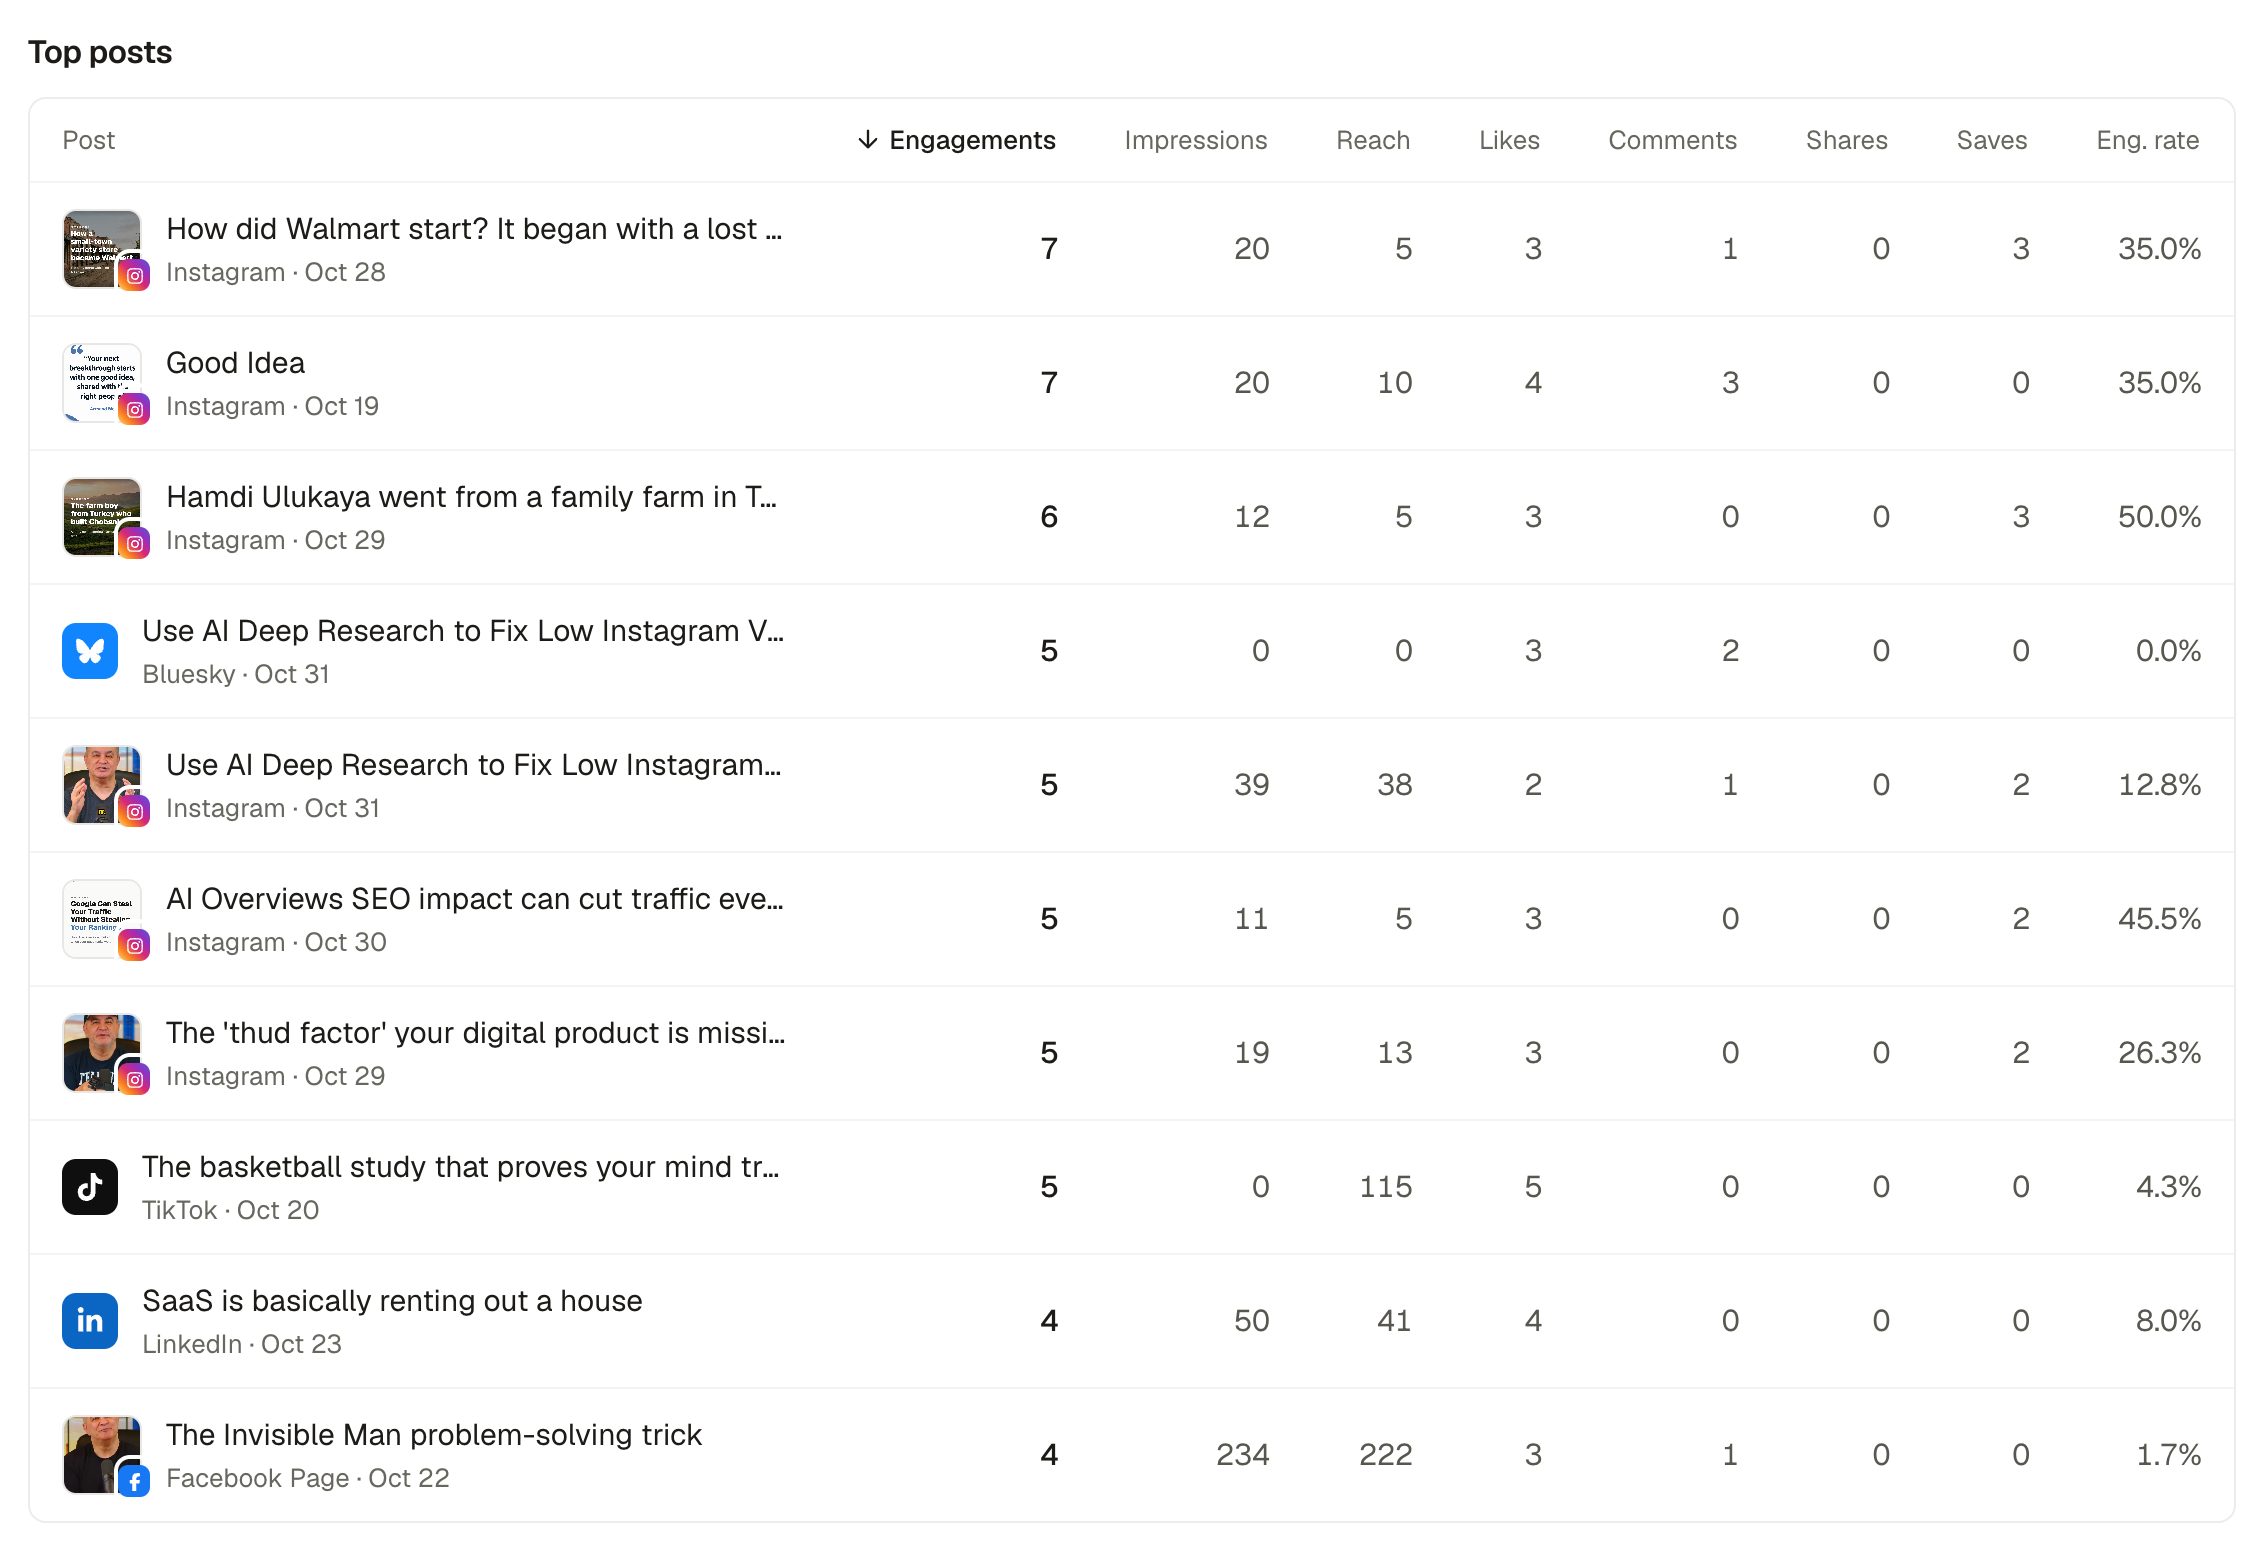
Tracked links
Links you shorten with Track links in the composer are listed here with their clicks.
Messages and comments
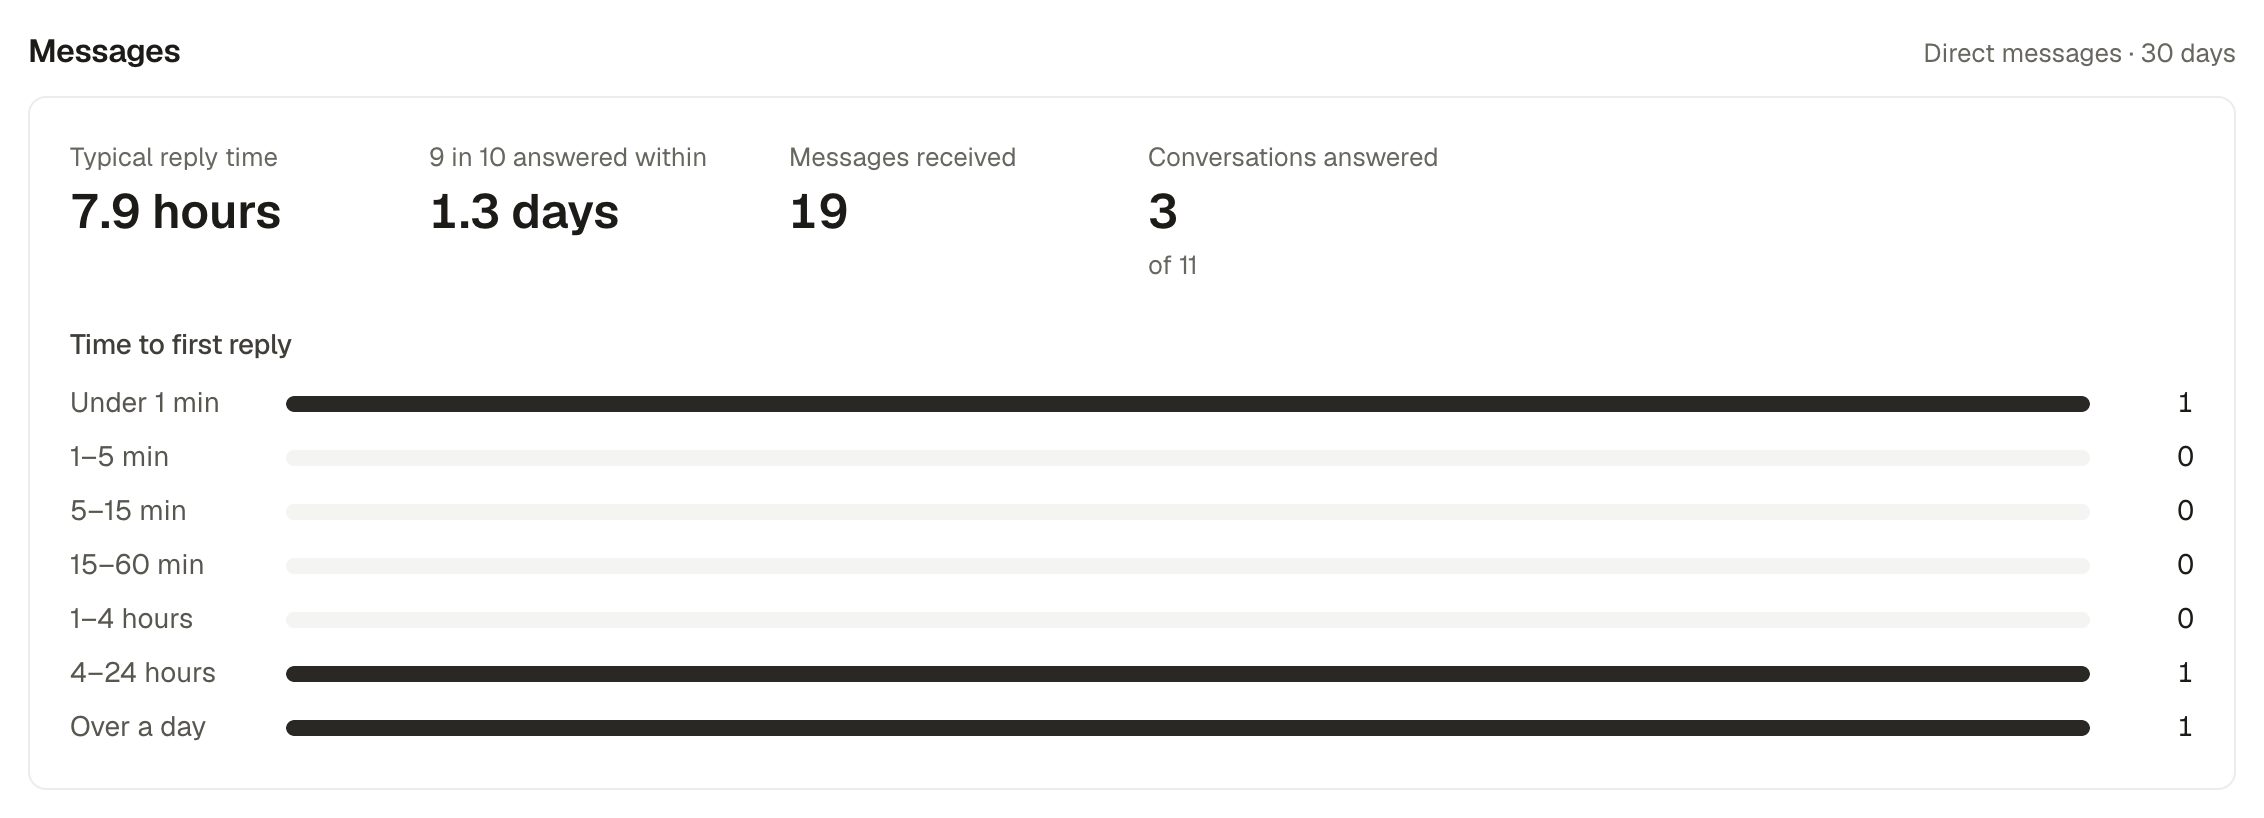
Reply times only count conversations you answered. What people are saying sums up how people feel in recent comments (positive, neutral, negative) with the common themes and real example comments. It needs a handful of comments to appear.
Best time to post
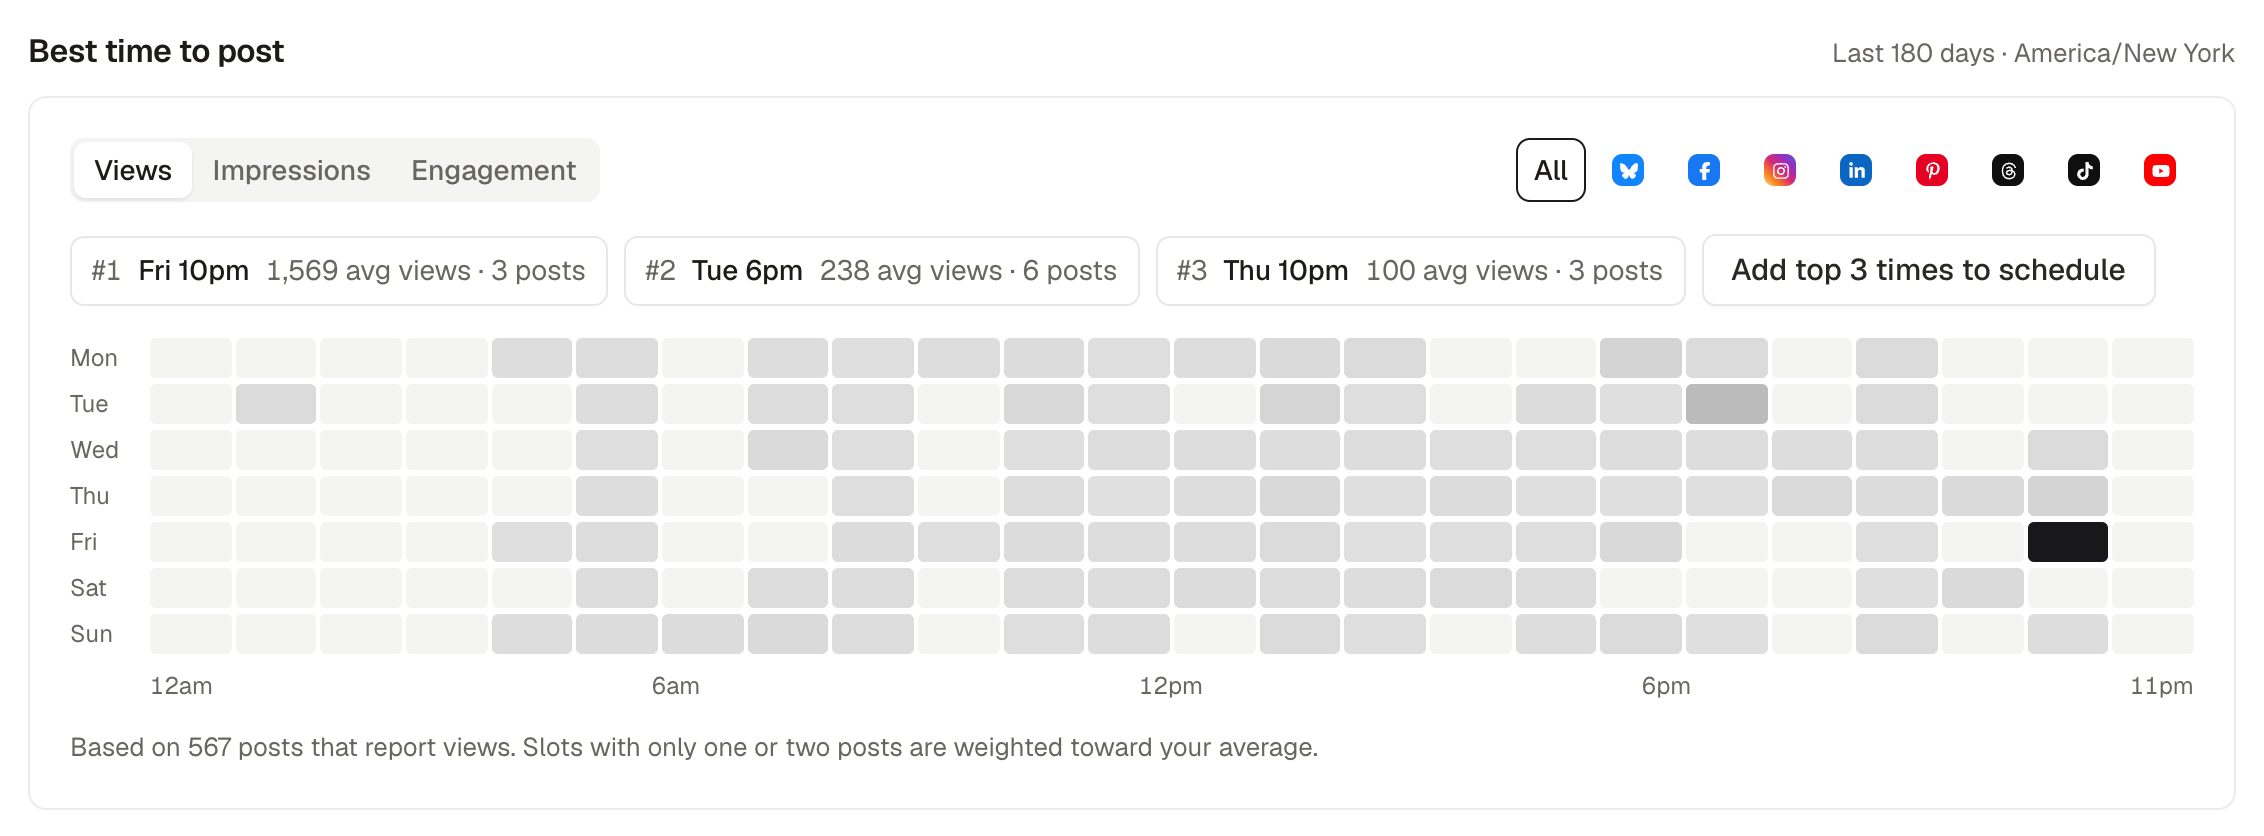
The top three times are listed above the map. Add top 3 times to schedule adds them to your posting times. Times with only one or two posts are weighted down so a single lucky post doesn't skew it.
Channels
Client reports
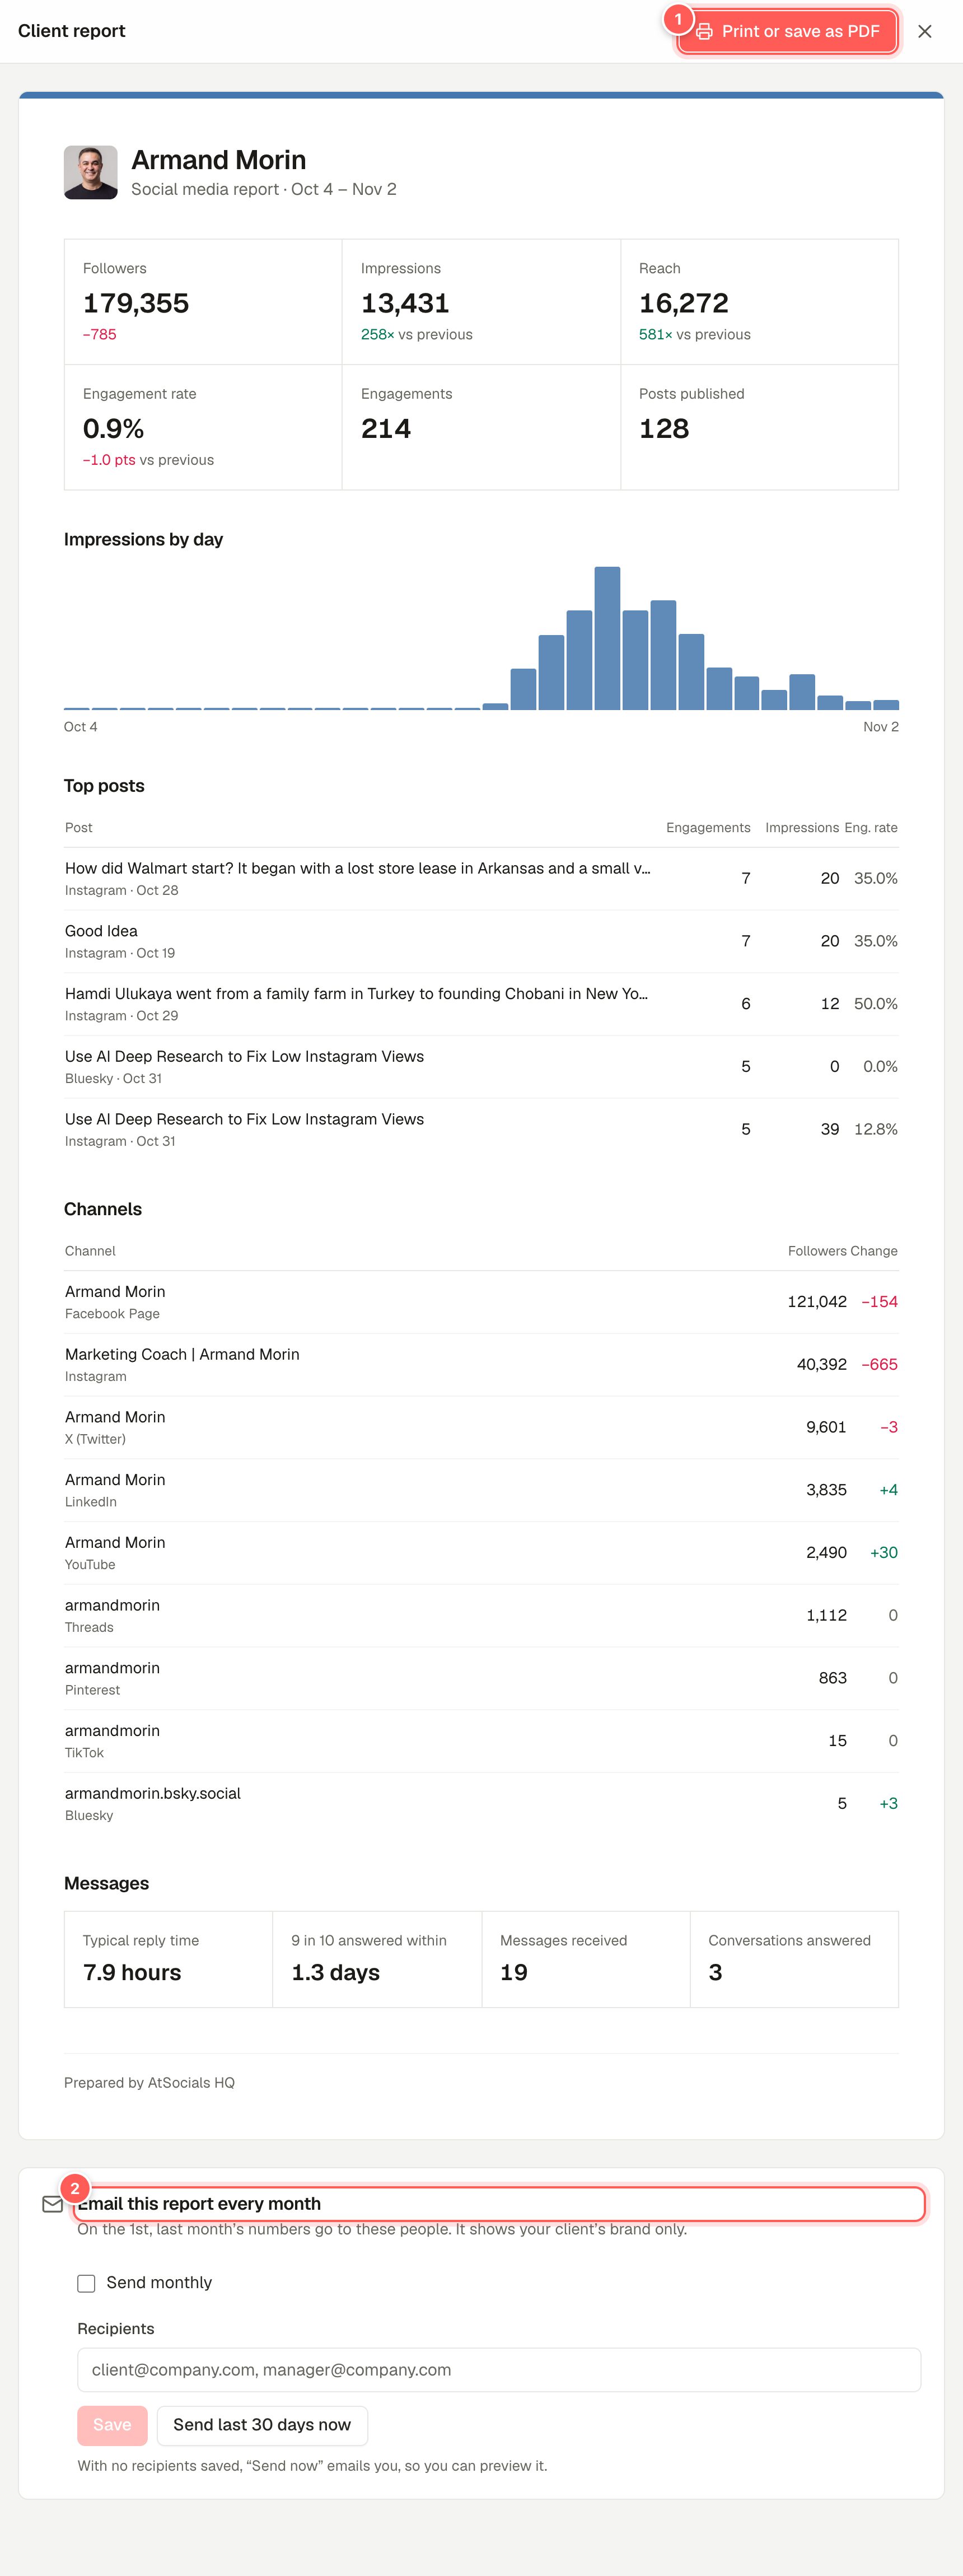
- Print or save as PDF opens your browser's print dialog. Choose Save as PDF to get a file.
- Email this report every month. Tick Send monthly and add recipients. On the 1st of each month they get last month's numbers. Send last 30 days now sends one straight away.